 Saraswathy← Back to work
UI/UX Case Study
Cyber Threat Intelligence Platform
A Single Console to Monitor & Neutralise Threats
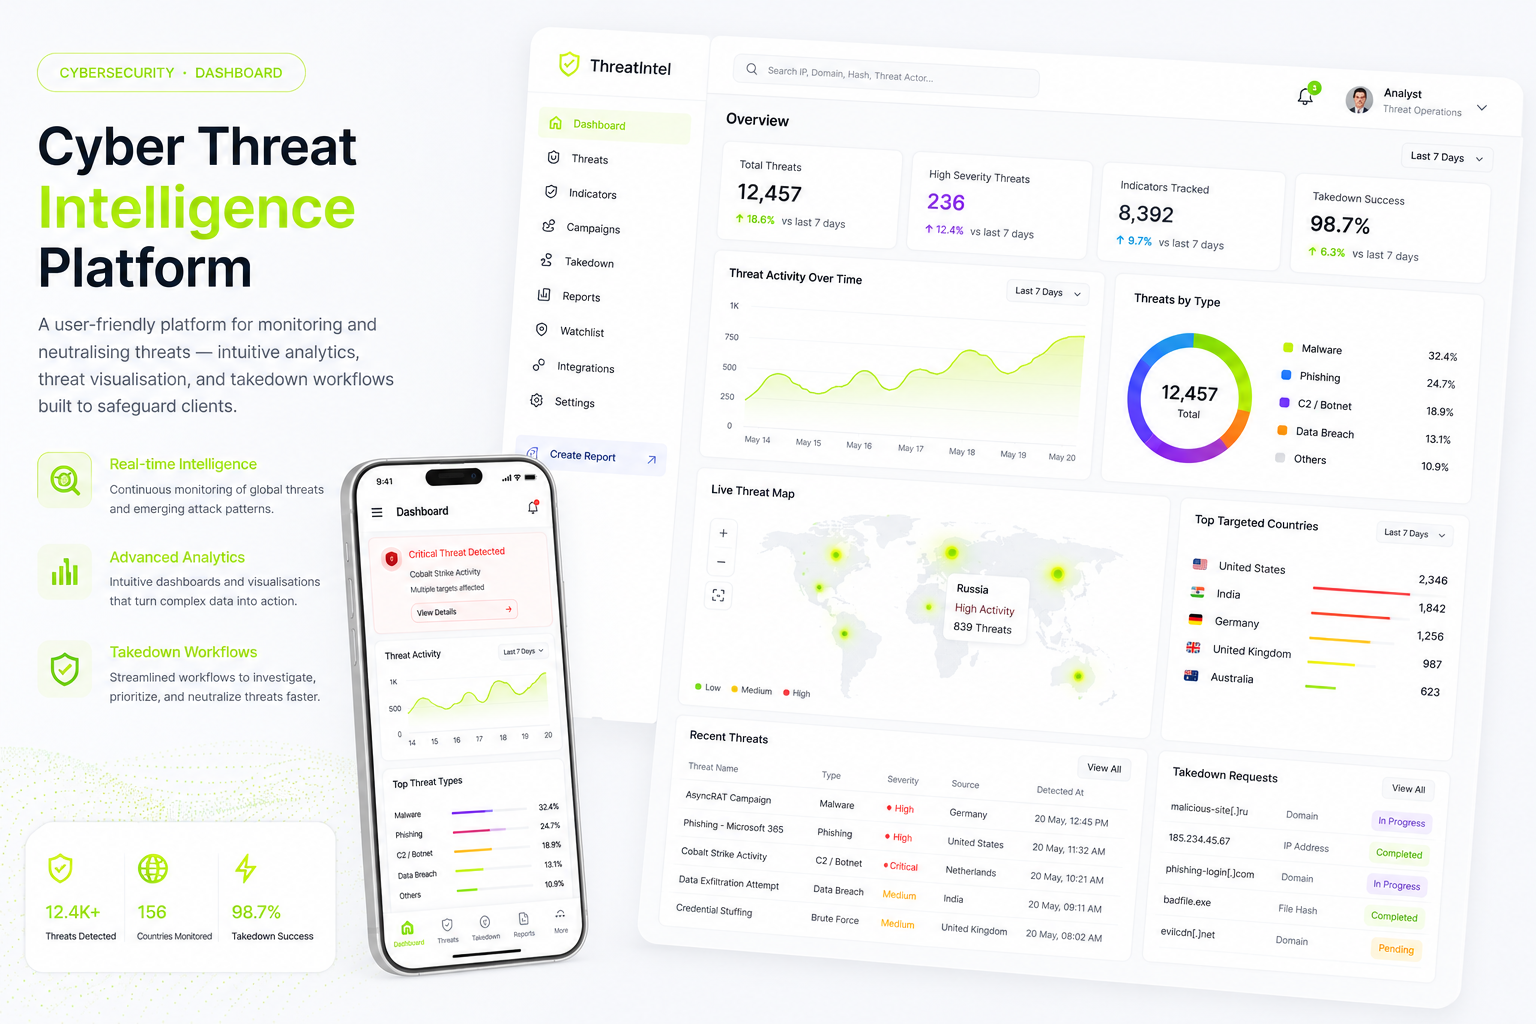
An analyst console for monitoring, prioritising, and taking down threats — real-time analytics, clear threat visualisation, and takedown workflows that cut detection-to-response time.
- Role
- UI/UX Designer
- Platform
- Web App (analyst console)
- Category
- Cybersecurity · Analytics · SaaS
- Type
- Dashboard & workflow design
Problem Statement
Security analysts drown in threat data spread across disconnected tools. Alerts arrive faster than they can be triaged, prioritisation is unclear, and the status of an active takedown is hard to see. The result is slow response, alert fatigue, and poor visibility for the stakeholders relying on the team to keep clients safe.
This leads to
- Slow detection-to-response
- Missed or de-prioritised threats
- Analyst alert fatigue
- Fragmented tooling
- Low visibility for stakeholders
Design Challenge
How might we help analysts monitor, prioritise, and neutralise threats from a single, clear console — without adding more noise?
Proposed Solution
A unified threat-intelligence console: a real-time overview dashboard, a prioritised threat feed, rich threat detail, a geo/relationship visualisation, and an end-to-end takedown workflow with status tracking and reporting. The interface foregrounds severity and next action so analysts always know what to tackle first.
User Story
As a security analyst,
I want one console to spot, prioritise, and act on threats,
so that I can neutralise the most important ones faster and prove it was handled.
Target Users
- SOC analysts and threat hunters
- Incident-response teams running takedowns
- Security managers tracking team performance
- Stakeholders needing threat reporting
Research Insights
Key Requirements
Functional
- Real-time overview of active threats
- Prioritised, filterable threat feed
- Detailed threat view with context
- Geo and relationship visualisation
- Takedown workflow with status stages
- Assign threats to analysts
- Generate and export reports
Non-functional
- Fast under high alert volume
- Scannable, low-noise information design
- Accessible colour and contrast for severity
- Consistent components across views
- Reliable real-time updates
User Flow
- 1Analyst signs in to the console→
- 2Reviews the real-time overview→
- 3Scans the prioritised threat feed→
- 4Opens a high-severity threat→
- 5Investigates context and relationships→
- 6Starts a takedown workflow→
- 7Tracks status to resolution→
- 8Generates a report for stakeholders
Screen Breakdown
Overview Dashboard
Give analysts the state of all threats at a glance.
- Key metrics and trend charts
- Threats by type and severity
- Active takedowns summary
- Recent activity
Threat Feed
Help analysts decide what to handle first.
- Severity-sorted threat list
- Filters by type, status, source
- Inline severity and status badges
- Bulk and quick actions
Threat Detail
Provide full context to investigate a threat.
- Indicators and evidence
- Timeline and source data
- Related threats and assets
- Assign · Escalate · Start takedown
Takedown Workflow
Track a threat from detection to neutralisation.
- Clear status stages
- Owner and SLA timing
- Notes and action history
- Completion confirmation
Threat Map & Reports
Visualise spread and communicate outcomes.
- Geo map of threat origins
- Relationship graph
- Exportable reports
- Shareable summaries
Wireframe Structure
┌───────────┬───────────────────────┐
│  Nav      │ Threats  Resolved  SLA │
│  • Home   ├───────────────────────┤
│  • Feed   │  ╭ trend ╮  ╭ donut ╮  │
│  • Map    │  ╰───────╯  ╰───────╯  │
│  • Report ├───────────────────────┤
│           │ Active takedowns ····· │
└───────────┴───────────────────────┘
┌─────────────────────────────────┐
│ Threat #88   Severity: HIGH      │
├──────────────┬──────────────────┤
│ Indicators   │ Related          │
│ • IP / URL   │ • Asset A        │
│ • Hash       │ • Threat #72     │
├──────────────┴──────────────────┤
│ [ Assign ][ Escalate ][ Takedown]│
└─────────────────────────────────┘
Key UX Decisions
Severity-led information design
Colour, order, and badges put the most dangerous threats first so triage is instant.
One console, many signals
Unifying feeds removes tool-switching and the gaps where threats slip through.
Visible takedown stages
A staged workflow makes progress and ownership obvious to the whole team.
Visualisation for relationships
Maps and graphs reveal patterns a list can’t, speeding investigation.
Reporting built in
Exportable reports turn analyst work into stakeholder confidence with no extra effort.
Acceptance Criteria
- ✓Real-time overview of threats
- ✓Prioritised, filterable feed
- ✓Detailed threat context view
- ✓Geo and relationship visualisation
- ✓Takedown workflow with stages
- ✓Threats can be assigned
- ✓Reports can be generated and exported
- ✓Accessible severity colour system
Expected Impact
Business
- — Faster detection-to-response
- — Fewer missed threats
- — Better stakeholder visibility
- — More efficient analyst teams
- — Stronger client safeguarding
User Experience
- — Clear priorities, less noise
- — One place to investigate and act
- — Confidence in takedown status
- — Less alert fatigue
- — Faster, calmer triage
Success Metrics
- Mean time to detect
- Mean time to respond
- Threats triaged per analyst
- Takedown completion rate
- Backlog / queue age
- Escalation accuracy
- Report generation time
- Analyst satisfaction
Final Outcome
The console turns scattered alerts into a clear, prioritised workflow. Analysts see what matters first, investigate with full context, and drive takedowns to completion — cutting response time while giving stakeholders the visibility they need.